
 Pete Shadbolt
37dd9265ce
Pete Shadbolt
37dd9265ce
|
9年前 | |
|---|---|---|
| abp | 9年前 | |
| bin | 9年前 | |
| doc | 9年前 | |
| examples | 9年前 | |
| tests | 9年前 | |
| .bumpversion.cfg | 9年前 | |
| .gitignore | 9年前 | |
| MANIFEST.in | 9年前 | |
| README.md | 9年前 | |
| TODO.mkd | 9年前 | |
| makefile | 9年前 | |
| setup.py | 9年前 | |
README.md
abp
Python port of Anders and Briegel’ s method for fast simulation of Clifford circuits. You can read the full documentation here.
Installation
It's easiest to install with pip:
$ pip install --user abp
Or clone and install in develop mode:
$ git clone https://github.com/peteshadbolt/abp.git
$ cd abp
$ python setup.py develop --user
$ python setup.py develop --user --prefix=  # Might be required on OSX
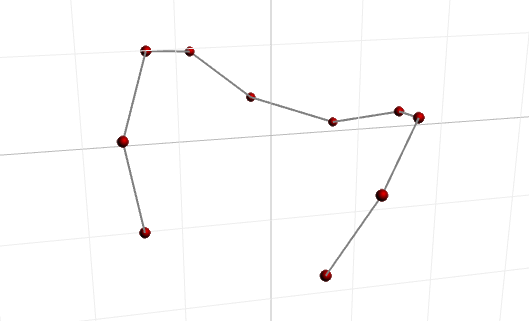
Visualization
abp comes with a tool to visualize graph states in a web browser. It uses a client-server architecture.
First, run abpserver in a terminal:
$ abpserver
Listening on port 5000 for clients..
Then browse to http://localhost:5001/. Alternatively, abpserver -v will automatically pop a browser window.
Now, in another terminal, use abp.fancy.GraphState to run a Clifford circuit:
>>> from abp.fancy import GraphState
>>> g = GraphState(range(10))
>>> for i in range(10):
...     g.act_hadamard(i)
...
>>> g.update()
>>> for i in range(9):
...     g.act_cz(i, i+1)
...
>>> g.update()
And you should see a visualization of the state:
Testing
abp has a bunch of tests. You can run them all with nose:
$ nosetests
53 tests run in 39.5 seconds (53 tests passed)
Currently I use some reference implementations of chp and graphsim which you won't have installed, so some tests will be skipped. That's expected.